Logistic regression is called regression, but it is used for classification. It predicts a probability, and you decide what to do with that probability.
What logistic regression actually computes
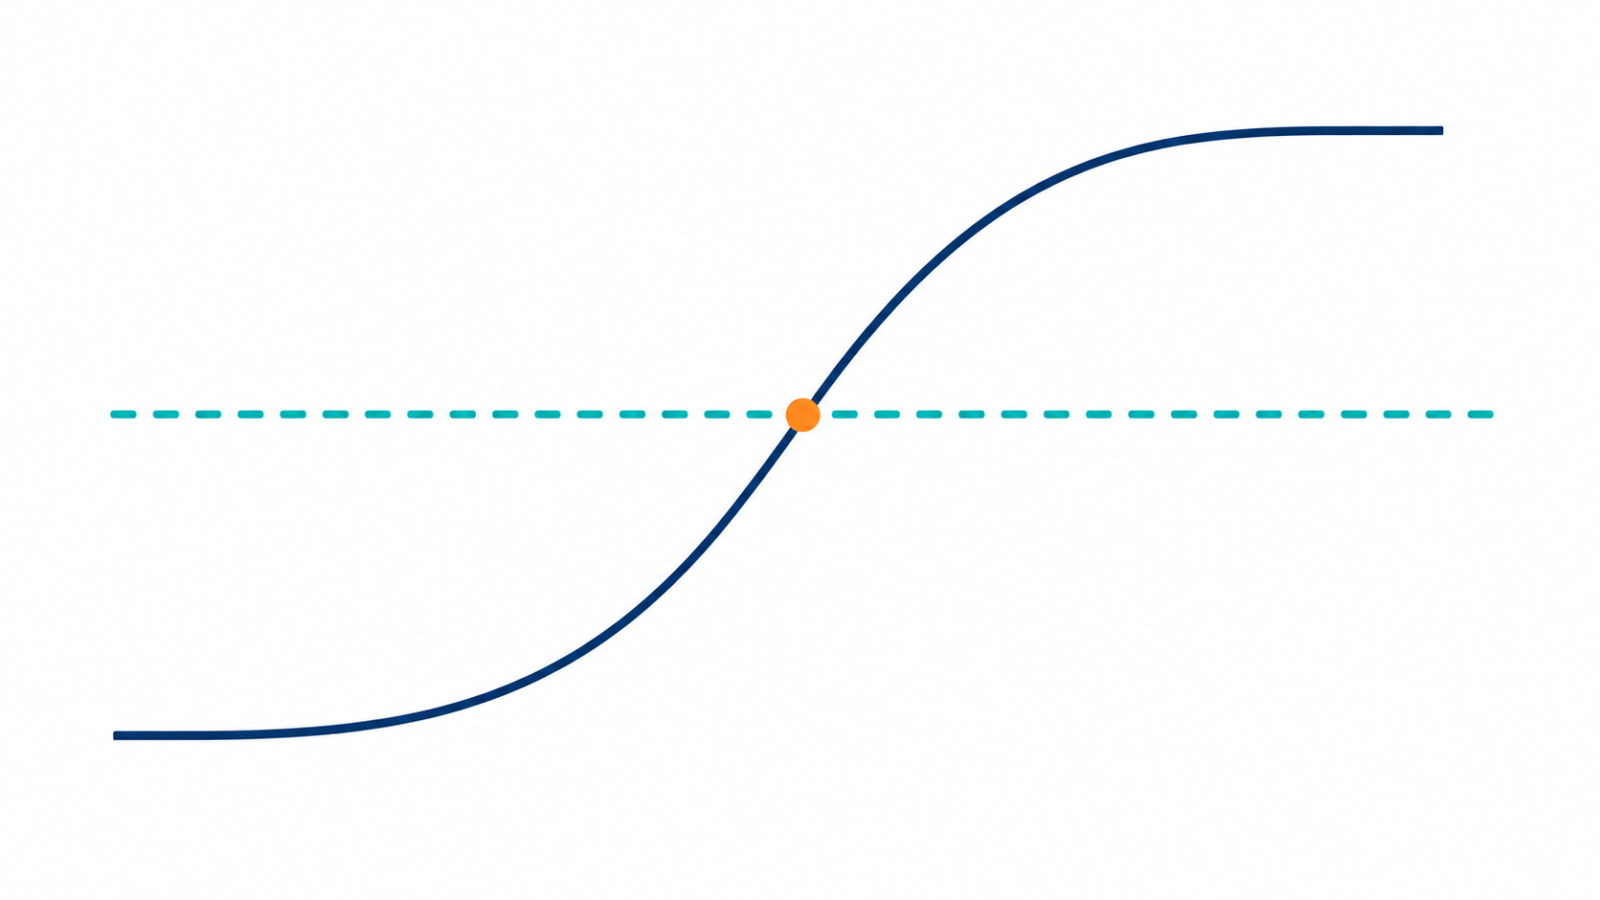
The model takes a weighted sum of your features, the same as linear regression, then passes it through the sigmoid function, which squeezes any number into the range 0 to 1. That output is read as the probability of the positive class. To get a class label, you compare the probability to a threshold.
What the coefficients mean
Each coefficient describes a change in the log-odds of the positive class for a one-unit increase in that feature, with the other features held constant. Log-odds are hard to reason about, so most people exponentiate a coefficient to get an odds ratio. An odds ratio of 1.5 means the odds of the positive class are multiplied by 1.5 for each one-unit increase. This readability is a large part of why the model is still used when explanations matter.
The threshold is a decision, not a default
Most libraries classify as positive at a probability of 0.5, but that number is a convention, not a rule. If missing a positive case costs far more than a false alarm, a lower threshold is usually better, and the reverse holds when false alarms are expensive. Choose it from your own cost trade-offs, using tools like the confusion matrix and the precision-recall curve. With rare positives, see also how to handle imbalanced datasets.
Scale your features and regularize
Regularization penalizes large coefficients, which helps when you have many features or limited data. scikit-learn applies L2 regularization by default, which is covered in L2 regularization explained. Because the penalty depends on coefficient size, features on very different scales should be standardized first. Scaling also helps the optimizer converge.
Correlated features make coefficients unreliable
When two features carry nearly the same information, the model can split credit between them in unstable ways, and individual coefficients can swing or even flip sign between samples. Predictions may stay fine while the interpretation breaks. The detection and fixes are the same ones described in multicollinearity in regression.
Where logistic regression falls short
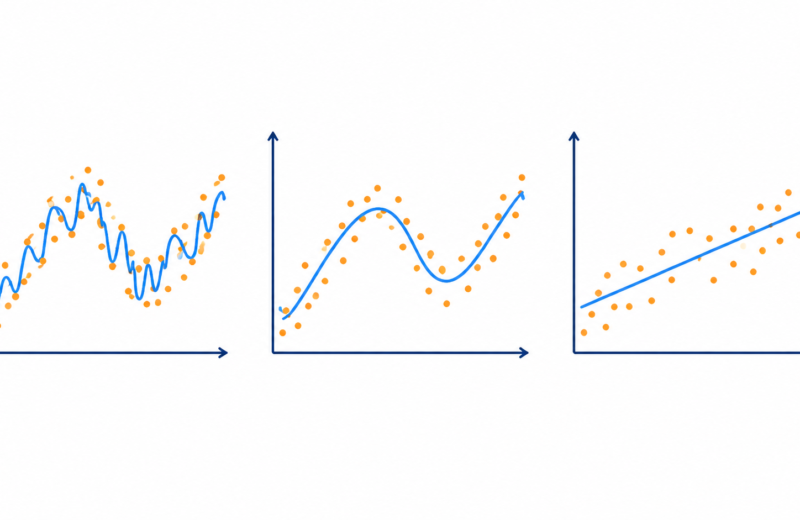
The model assumes the log-odds are a linear combination of your features. If the true relationship is nonlinear, or depends on interactions, it will underfit unless you add those terms yourself. A model like a decision tree finds such structure automatically, at the cost of stability. Even so, logistic regression makes a strong baseline model: fast to train, easy to explain, and hard to beat by much on many tabular problems.
A quick checklist
- Did you standardize the features before fitting a regularized model?
- Did you pick the decision threshold from your costs instead of leaving it at 0.5?
- Did you check for strongly correlated features before interpreting coefficients?
- Are you reporting odds ratios, not raw log-odds, to non-technical readers?
- Did you compare more complex models against this one?
FAQ
Is logistic regression a classification or regression algorithm?
It is a classification algorithm. The name comes from the fact that it fits a linear model to the log-odds, but its output is a probability used to assign classes.
Does logistic regression need feature scaling?
Not for the math to work, but scaling is recommended when you use regularization, because the penalty depends on coefficient size. It also helps the optimizer converge.
Can logistic regression handle more than two classes?
Yes. It can be extended to multiple classes, for example with a softmax formulation or by fitting one model per class.