
Olist E-Commerce Analytics Engineering
Analytics engineering on a real 99,441-order e-commerce dataset: a dbt star schema on DuckDB, 34 automated data tests, and a self-serve Streamlit dashboard.
Problem
A real 99,441-order e-commerce dataset arrives as flat, disconnected exports that analysts can't query efficiently or trust.
Solution
A dbt star schema on DuckDB with 34 automated tests, exposed through a self-serve Streamlit dashboard for non-technical stakeholders.
Overview
Real e-commerce data is messy: 99,441 real orders from the Olist dataset, spread across normalized tables that aren’t built for fast analytical queries.
How it works
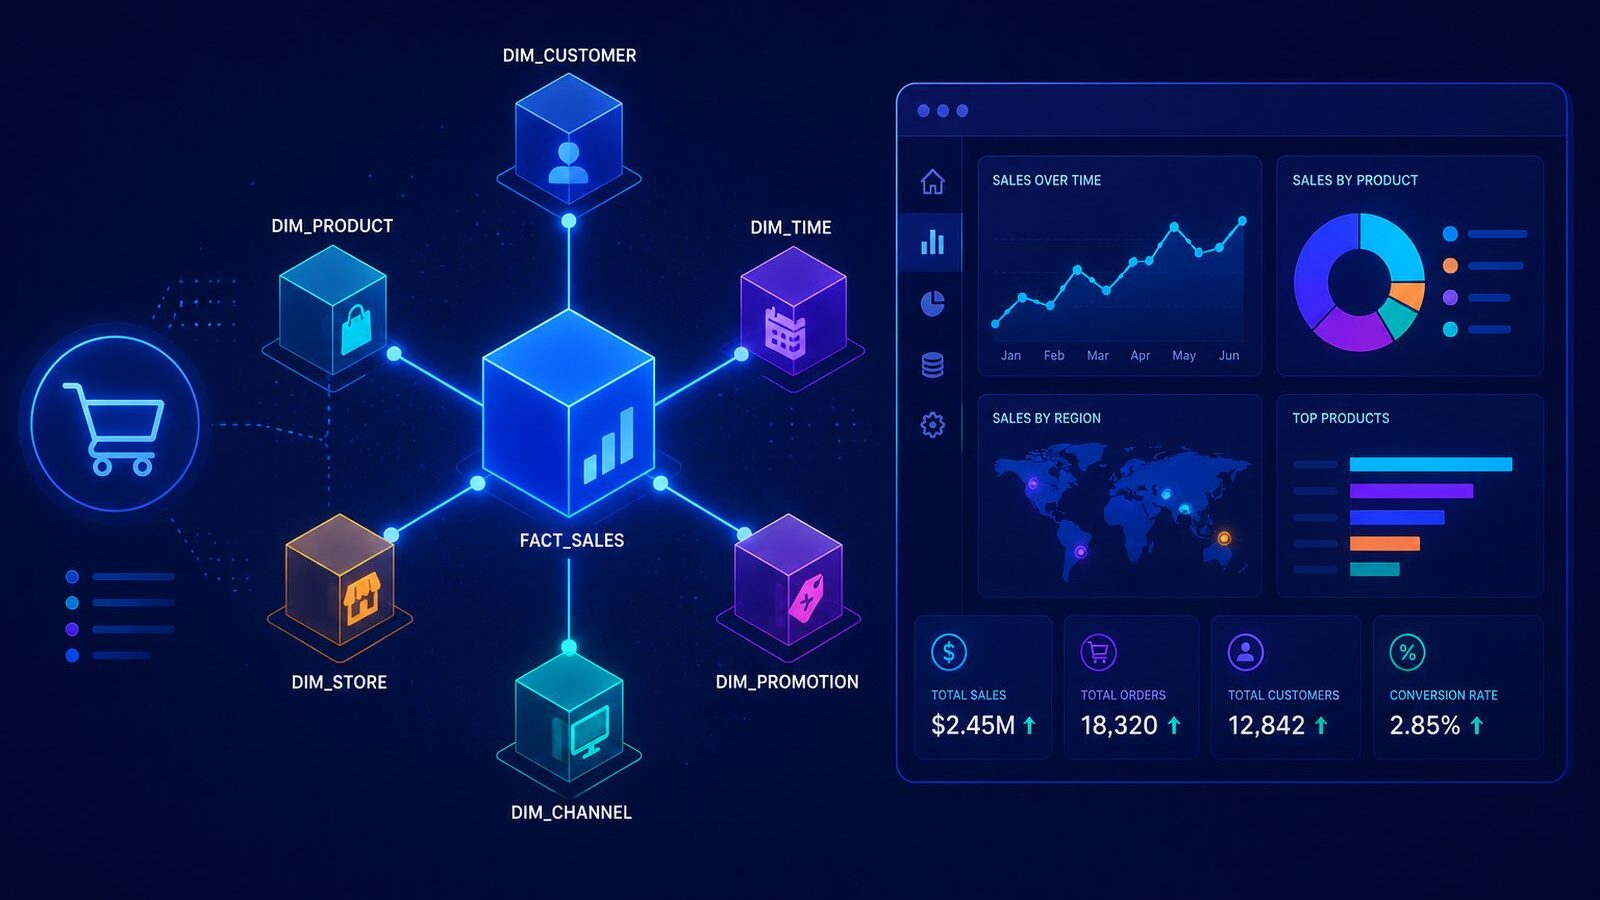
The raw tables are modeled into a proper dbt star schema on DuckDB — a central fact table of orders surrounded by customer, product, seller and time dimensions — with 34 automated tests verifying the model at every layer. A self-serve Streamlit dashboard sits on top so a non-technical stakeholder can explore sales, delivery performance and customer behavior without writing SQL.
Result
A real, messy dataset turned into a trustworthy, query-fast analytical model with a usable interface on top — the full analytics-engineering loop, not just a script.
Further reading
See From Notebook to Data Product and dbt + DuckDB vs a Cloud Warehouse for more on why this stack was chosen and why the Streamlit dashboard matters.
More projects
Retail Analytics Warehouse
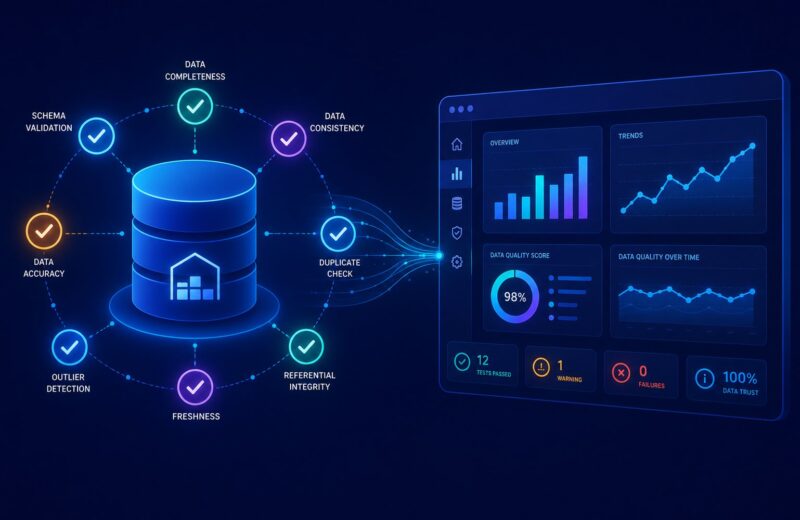
A dbt + DuckDB ELT pipeline over synthetic retail data, with 35 automated data-quality tests and a Streamlit dashboard.
Support Ticket Triage Platform
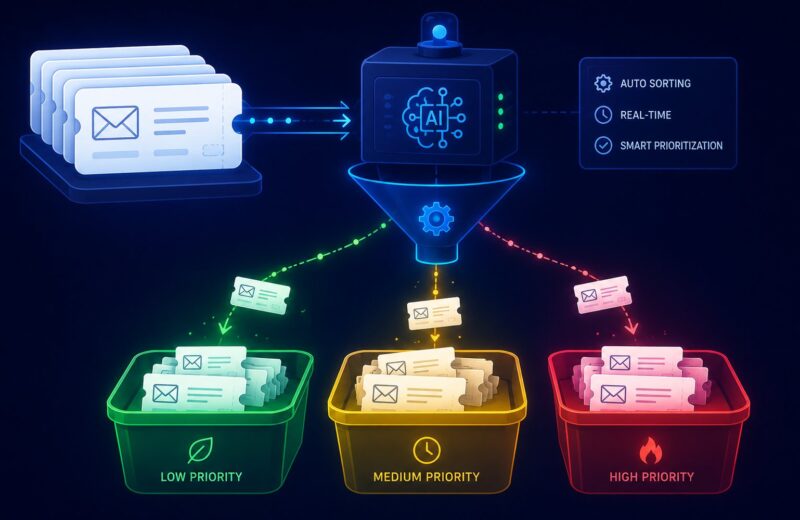
A support-ticket triage platform with a Gradio UI and MLflow experiment tracking for model iteration.

Knowledge-Base Search (RAG)
A knowledge-base search system built with retrieval-augmented generation for accurate, grounded question answering.