An org chart shows who reports to whom. It does not show who actually talks to whom, where information gets stuck, or which teams are quietly isolated. Organizational network analysis answers those questions by treating communication as a graph and measuring its structure.
Modeling people as a graph
In a network model, each person is a node, and an edge connects two people who communicate or collaborate. Edges can be undirected, meaning just a connection, or directed, meaning who contacted whom, and they can carry a weight such as the number of interactions. Typical raw material is message or meeting metadata from collaboration tools, reduced to who interacted with whom and how often. Collect only what you are permitted to use and report results in aggregate, because this kind of data is sensitive.
A first example with NetworkX
NetworkX is the standard Python library for this work. The snippet below builds a tiny graph and computes the three measures most analyses start with.
import networkx as nx

G = nx.Graph()
G.add_edges_from([
    ("Ana", "Ben"), ("Ana", "Cara"), ("Ben", "Cara"),
    ("Cara", "Dev"), ("Dev", "Eli"), ("Dev", "Fay"), ("Eli", "Fay"),
])

degree = nx.degree_centrality(G)
betweenness = nx.betweenness_centrality(G)
communities = nx.community.greedy_modularity_communities(G)
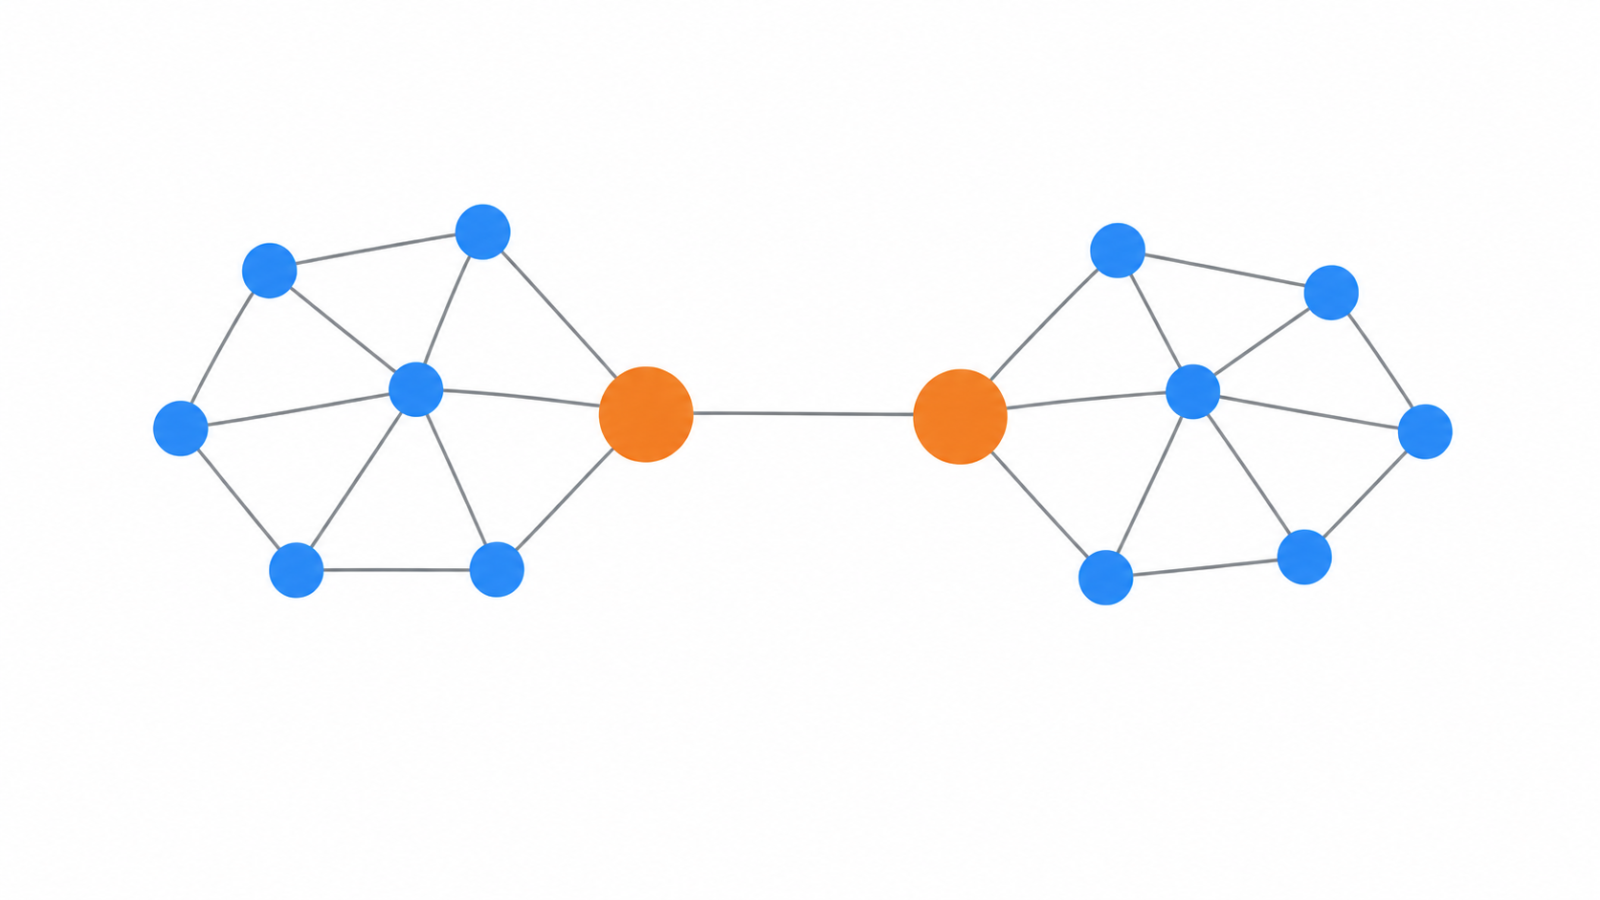
In this example, Cara and Dev connect two small clusters, so they should stand out on betweenness even though they are not the most connected people.
Degree centrality: who is well connected
Degree centrality is the share of other people a person is directly connected to. High values point to hubs, people many others reach out to. It is simple and easy to explain, but it only counts direct links and ignores where those links lead.
Betweenness centrality: who bridges groups
Betweenness centrality measures how often a person sits on the shortest path between two others. High values mark bridges and potential bottlenecks: people through whom information has to pass to get from one group to another. These are often the most revealing people in the network, and the ones whose absence would split it.
Community detection: which groups form
Community detection finds clusters of people who interact far more with each other than with the rest. A common approach, modularity optimization, is what the greedy_modularity_communities call above uses. Compare the detected communities with the formal teams. Where they match, the structure works as designed, and where they differ, you have found informal groups, or teams that rarely interact with anyone else.
How to read the results carefully
- Centrality is not importance. A highly connected person may just receive many automated messages.
- Your data covers only the channels you captured, so in-person conversations are invisible.
- Results depend on choices such as the interaction threshold and the time window, so test how stable they are.
- Use findings to improve how work flows, not to rank individuals.
Spotting unusual nodes
Some people will have extreme values, so look at the distribution before drawing conclusions. The approaches in outlier detection help separate real hubs from data artifacts. If you want to share the result as an interactive app, Streamlit vs Gradio compares two common options.
See it in a project
My Organizational Network Analysis project applies these ideas: communication data is modeled as a graph in NetworkX, and degree centrality, betweenness and community detection reveal influence hubs, cross-team bridges and isolated clusters.
A quick checklist
- Do you have permission to use the communication data, and are you reporting in aggregate?
- Did you decide whether edges are directed and weighted?
- Are you reading degree, betweenness and communities together?
- Did you check how stable the results are to your threshold and time window?
- Are you using the findings to improve workflows, not to rank people?
FAQ
What is organizational network analysis?
It is the study of how people in an organization actually communicate and collaborate, using graph metrics to find hubs, bridges and isolated groups that an org chart does not show.
Which Python library is used for network analysis?
NetworkX is the most widely used. It provides centrality measures, community detection and graph drawing.
What does betweenness centrality tell you?
It shows how often a person lies on the shortest path between two others, which identifies bridges between groups and possible information bottlenecks.