An A/B test compares two versions of something by showing each to a different, randomly chosen group of people and measuring which does better. The idea is simple, and most of the mistakes happen in the planning and in reading the result.
How an A/B test works
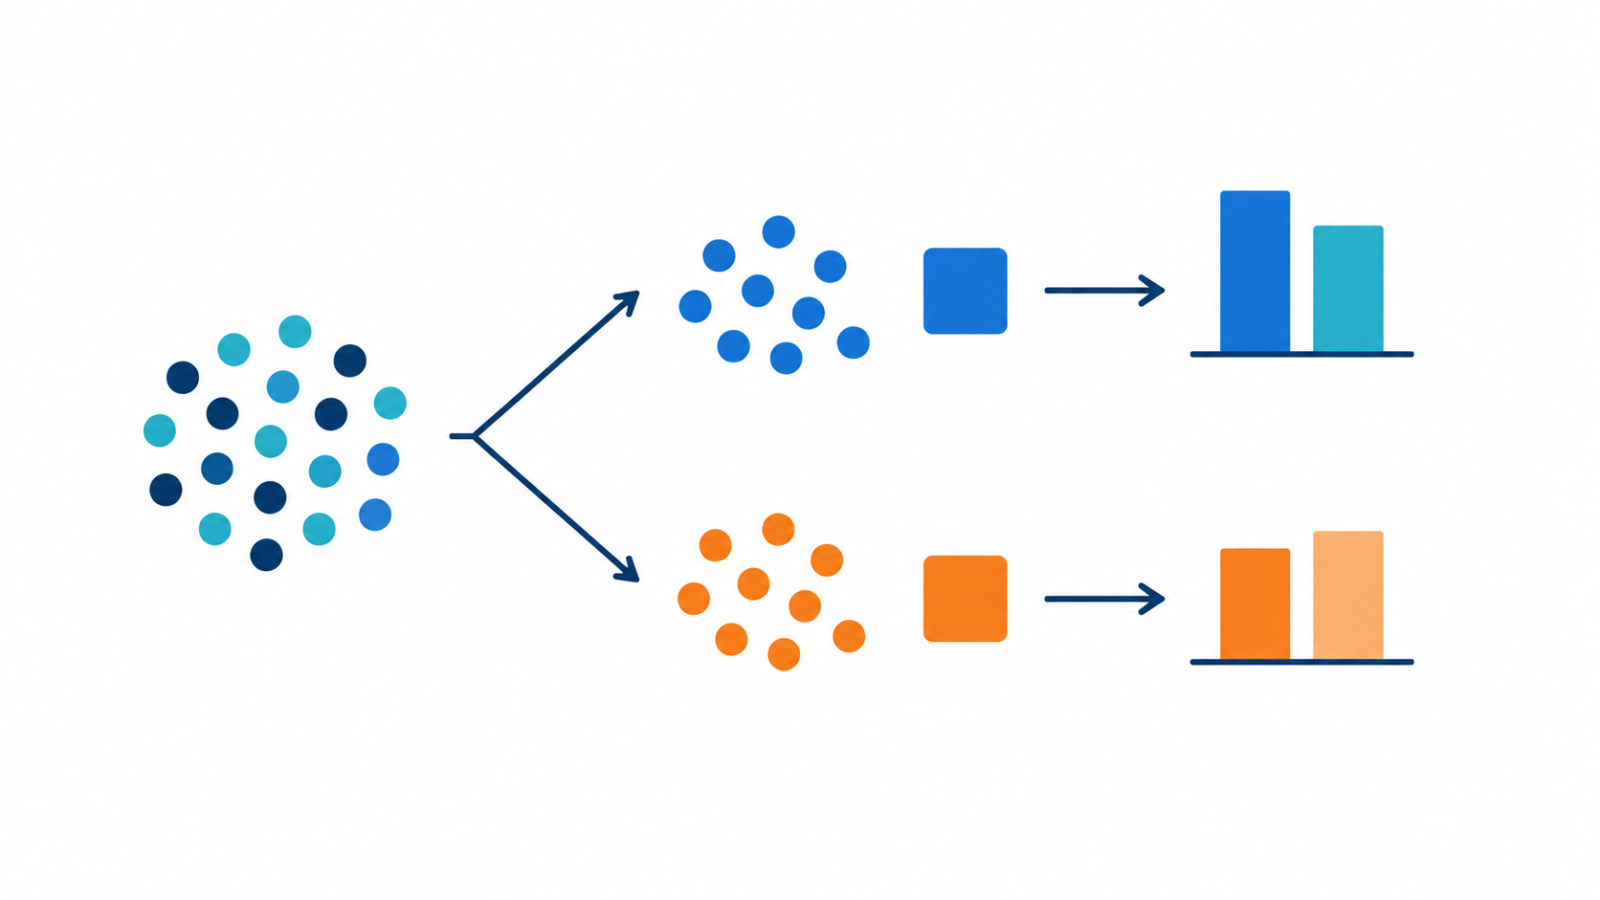
You split users at random into a control group, which sees the current version, and a variant group, which sees the change. Random assignment is the key step: it makes the two groups similar on average, so a difference in the outcome can be credited to the change and not to who happened to land in each group. You then compare a chosen metric, such as conversion rate, between the groups.
Decide before you start
Write down the hypothesis, the one primary metric you will judge the test on, and how many users you need, before any data comes in. The required sample size depends on how small a difference you want to detect and how noisy the metric is. Smaller effects and noisier metrics need more users. Deciding afterward which metric to look at is one of the easiest ways to fool yourself. The framing of the hypothesis itself is covered in null vs alternative hypothesis.
What a p-value tells you
A p-value is the probability of seeing a difference at least as large as the one you observed if there were actually no real difference. It is not the probability that the variant is better, and it is not the probability that your result is a fluke. A small p-value is evidence against the idea that nothing changed, nothing more. Many teams use 0.05 as a threshold, but that number is a convention, and you should choose it before the test.
Statistical and practical significance
With enough users, a tiny difference can be statistically significant while being too small to matter. Look at the size of the effect and its confidence interval as well as the p-value, and ask whether the change is worth the cost of shipping it. A significant result that moves the metric by a negligible amount is a finding, not a win.
The peeking problem
If you check the results every day and stop the moment the p-value dips below your threshold, you will declare far more false winners than the threshold suggests. Each look is another chance for random noise to cross the line. Either fix the sample size in advance and look once, or use a method designed for continuous monitoring, such as sequential testing.
Other ways tests go wrong
Testing many variants or many metrics at once raises the chance that something looks significant by luck, so adjust for multiple comparisons. A sample ratio mismatch, where the groups are not the size you intended, usually points to a bug in assignment or logging and means the results should not be trusted yet. Short tests can also be distorted by a novelty effect or by weekday patterns, so run for whole weeks when behavior varies across the week. Checks like these on the underlying events are part of data observability.
A link to model evaluation
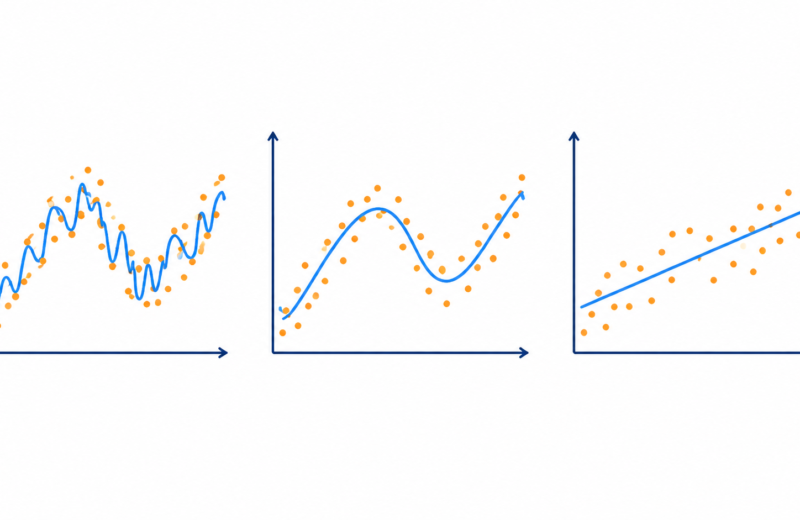
The same habits show up in machine learning: pick the metric first, do not tune against the data you will judge on, and distrust results that look too good. If you are comparing models, the trade-offs in bias and variance are a useful companion to what a test can and cannot prove.
A quick checklist
- Is the hypothesis written down, with one primary metric?
- Did you calculate the required sample size before starting?
- Is assignment random, and do group sizes match what you intended?
- Are you avoiding early stopping unless you use a sequential method?
- Do you report effect size and a confidence interval, not only the p-value?
FAQ
How long should an A/B test run?
Long enough to reach the sample size you planned, and usually for whole weeks so weekday patterns average out. Stopping as soon as the result looks good inflates false positives.
What does a p-value of 0.05 mean?
If there were truly no difference, you would see a result at least this extreme about 5 percent of the time. It does not mean there is a 95 percent chance the variant is better.
What is a sample ratio mismatch?
It is when the actual split between groups differs from the intended split by more than chance would explain. It usually signals a bug in assignment or tracking.