
Retail Analytics Warehouse
A dbt + DuckDB ELT pipeline over synthetic retail data, with 35 automated data-quality tests and a Streamlit dashboard.
Problem
Raw retail data needs to be reliable before it can be trusted for decisions, but most projects at this scale skip data-quality testing entirely.
Solution
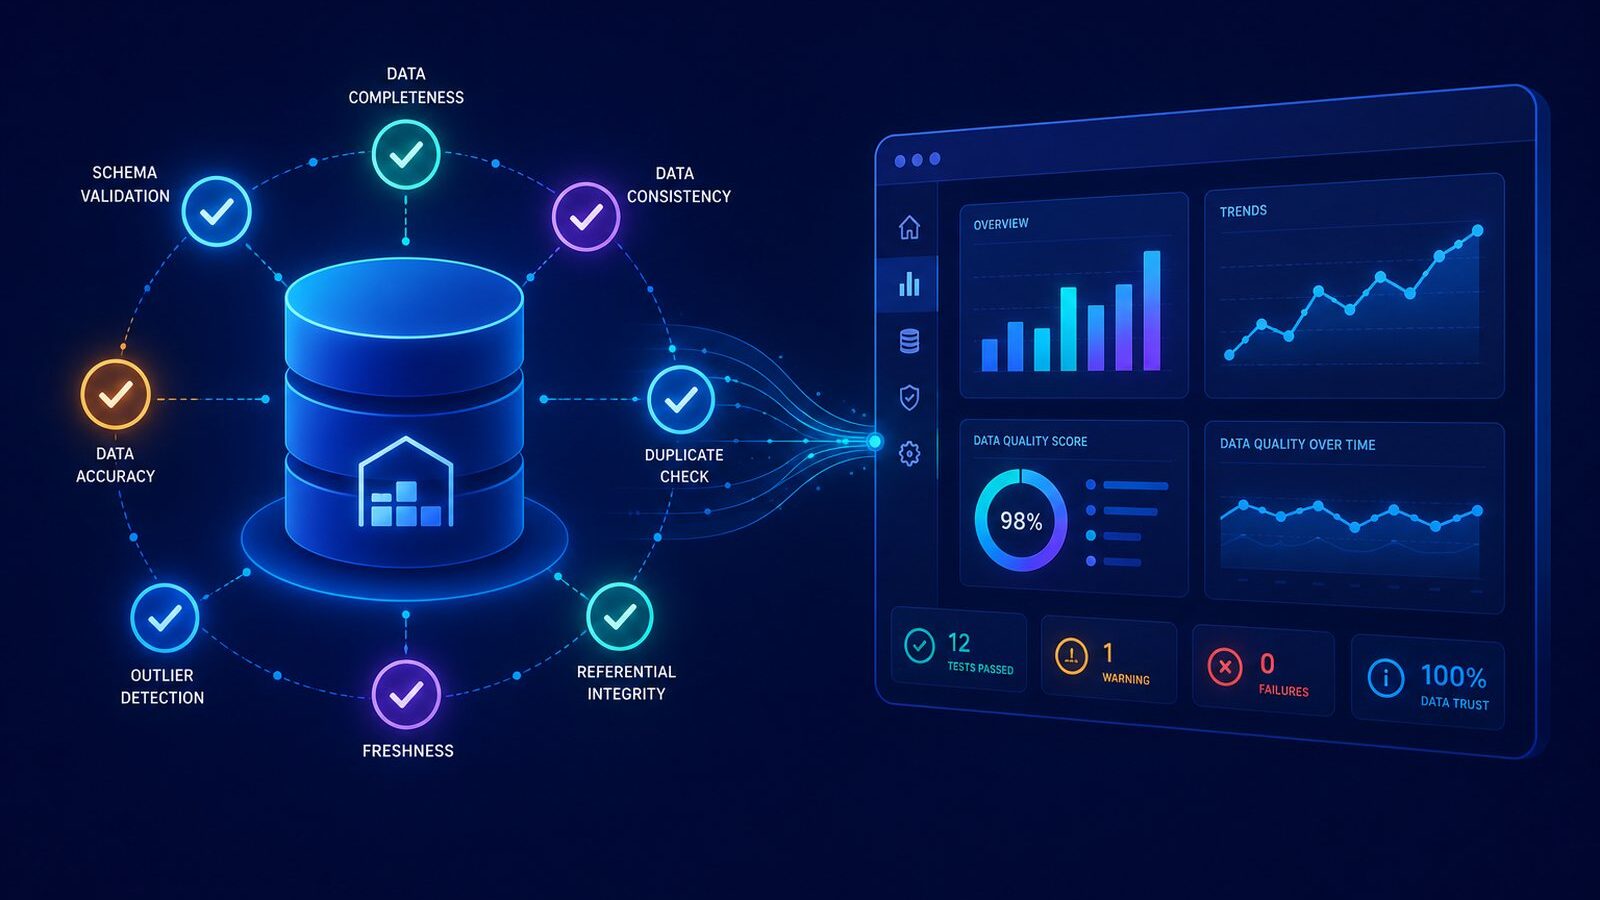
A dbt + DuckDB ELT pipeline with 35 automated data-quality tests and a Streamlit dashboard, so every number shown is backed by a passing test.
Overview
A dashboard is only as trustworthy as the data underneath it — and most personal-scale data projects skip testing that data entirely, so a broken pipeline can silently ship wrong numbers to a dashboard.
How it works
Retail data flows through a dbt + DuckDB ELT pipeline, with 35 automated data-quality tests (uniqueness, referential integrity, not-null, accepted values) running on every build. A Streamlit dashboard sits on top for exploration, so every chart is backed by a passing test suite, not just a hopeful assumption.
Result
A small-scale analytics stack that follows the same data-quality discipline as a production data engineering team, not just a one-off notebook.
Further reading
See Why Most Data Portfolios Get Rejected and dbt + DuckDB vs a Cloud Warehouse for more on why untested pipelines fail and why this stack was chosen.
More projects
Support Ticket Triage Platform
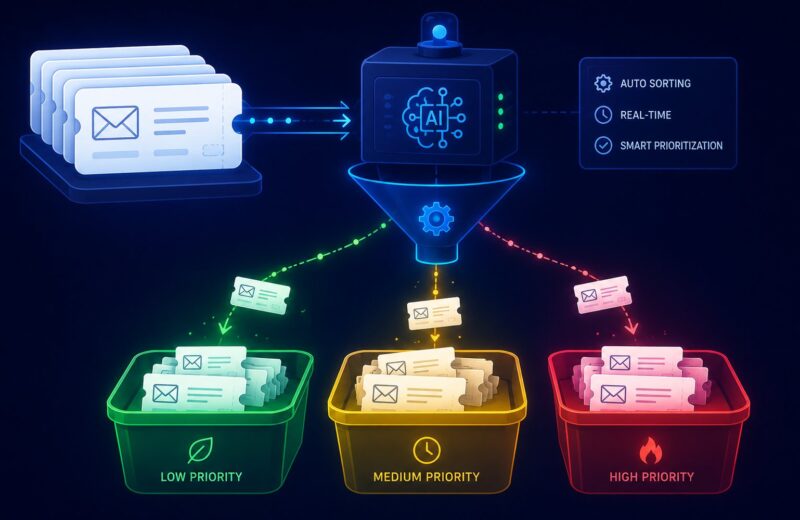
A support-ticket triage platform with a Gradio UI and MLflow experiment tracking for model iteration.
Retail ETL Warehouse
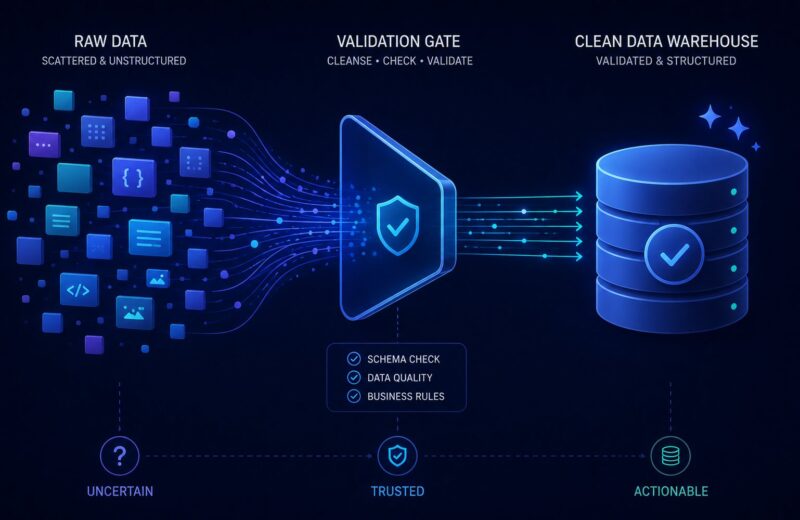
A production-style ETL pipeline: raw retail exports flow through a validated data-quality gate into a star-schema warehouse, SQL marts and…

Knowledge-Base Search (RAG)
A knowledge-base search system built with retrieval-augmented generation for accurate, grounded question answering.